This is a very rare pattern and does not happen that often, the share price rises to roughly the same area of resistance three times creating three peaks.
It does not have to be the perfect level of each other as long as its roughly near the peaks.
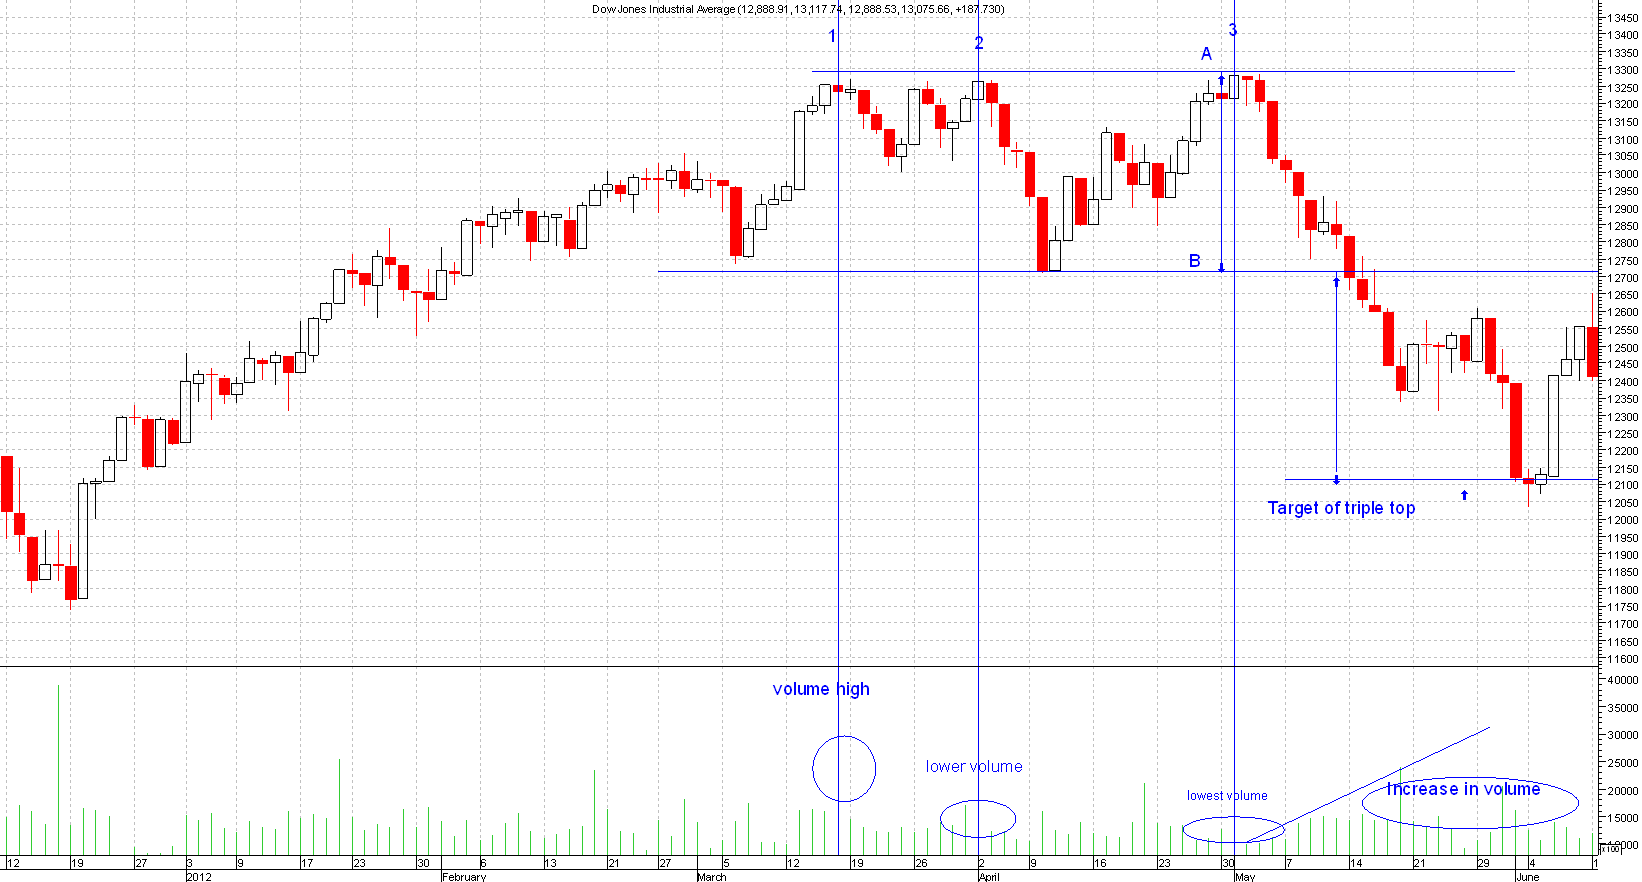
The signal completes when the price goes below the supports of the 2 lows that were created in the process that led to the triple top.
The volume goes down on each peak and the volume increases once the supports breaks preceding the triple top.
This chart is of the Dow Jones Industrials.
Please click on chart below for larger image
These patterns are usually formed and appear only after an uptrend.
Targets
You have to take the peak(point A) and the lower supports(point B) as in the chart above and extend that length from the breakout point to have your targets.
As can be seen from the chart above it was a perfect trade as this generated 600 points profit.
