Earnings season is one of the most important periods in the trading calendar. When major companies report their quarterly results, the market reacts — sometimes sharply. Whether you trade US stocks directly or hold UK-listed funds with US exposure, knowing when these reports land is essential.
That’s why we’ve built the ChartsView Earnings Calendar — a free tool for all ChartsView members that tracks upcoming earnings dates across the S&P 500 and NASDAQ 100.
What Is an Earnings Calendar?
An earnings calendar shows you which publicly traded companies are scheduled to report their quarterly financial results, and when. Most US companies report four times a year, and the dates are clustered into “earnings seasons” that follow the end of each fiscal quarter.
For traders, these dates matter because earnings announcements often trigger significant price moves. A company that beats analyst expectations can gap up 5-10% overnight, while a miss can send shares tumbling. Knowing the schedule in advance lets you plan your trades, manage risk, and avoid unwelcome surprises.
What We’ve Built
Our earnings calendar gives you a clean, week-by-week view of upcoming earnings across the two most important US indices:
- S&P 500 — the 500 largest US companies by market capitalisation
- NASDAQ 100 — the 100 largest non-financial companies on the NASDAQ exchange, heavily weighted towards technology
Each entry shows you the company ticker, name, and reporting time. You’ll see colour-coded badges indicating whether the company reports BMO (Before Market Open) or AMC (After Market Close). This matters because BMO reports affect the opening price, while AMC reports set the tone for the following day.
Once results are in, the calendar displays EPS (Earnings Per Share) estimates alongside the actual reported figures. Beats are highlighted in green, misses in red — so you can see at a glance how the quarter played out.
How to Use It
Navigate to chartsview.co.uk/earnings-calendar and you’ll see the current week laid out in five columns, Monday to Friday. Use the Prev and Next buttons to move between weeks, or hit Today to jump back to the current week.
At the top, you can filter by index. The S&P 500 tab is selected by default, showing you the broadest coverage. Switch to NASDAQ 100 to focus on the big tech names, or select All to see everything.
The stats bar at the top gives you a quick summary: how many companies are reporting that week, how many before the open, how many after the close, and how many have already reported.
If you’re a logged-in ChartsView member with stocks in your Portfolio Tracker, any holdings with upcoming earnings will be highlighted with a star icon — so you never miss a report on a stock you own.
Why UK Traders Should Watch US Earnings
Even if you primarily trade UK stocks, US earnings season has a direct impact on your portfolio. When Apple, Microsoft, or NVIDIA report, the ripple effects are felt across global markets. A strong set of US tech results can lift the FTSE 100 at the open; a disappointing quarter from a US bank can drag sentiment lower worldwide.
Many UK investors also hold US stocks through platforms like Trading 212, Interactive Brokers, or IG. If that includes you, the earnings calendar is an essential planning tool.
We’re working on adding UK earnings dates for FTSE 100 companies in the near future — watch this space.
Try It Now
The Earnings Calendar is completely free for all ChartsView members. Head over to chartsview.co.uk/earnings-calendar to see what’s reporting this week. Data is refreshed daily from Finnhub, covering earnings dates up to three months ahead.
As always, if you have feedback or feature requests, drop a post in the forum — we’d love to hear from you.
The UK stock market continues to offer exciting opportunities for new investors in 2026. With the FTSE 100 evolving and new sectors emerging, there's never been a better time to learn the fundamentals of stock trading. Whether you're looking to build long-term wealth or explore active trading strategies, understanding the basics is your essential first step.
In this guide, we'll walk you through everything you need to know to get started — from opening your first brokerage account to placing your first trade on the London Stock Exchange.
The Dow Jones Industrial Average is under siege from all sides. Today's session opened with a 500+ point gap down after US and Israeli military strikes on Iran over the weekend — "Operation Epic Fury" — sent shockwaves through global markets. Oil spiked over 13%, gold surged past $5,400, and risk assets were dumped across the board.
But here's the thing: the technicals were already warning us. Let's break down what the chart is telling us and where US30 goes from here.
The Big Picture: The Wedge Has Broken
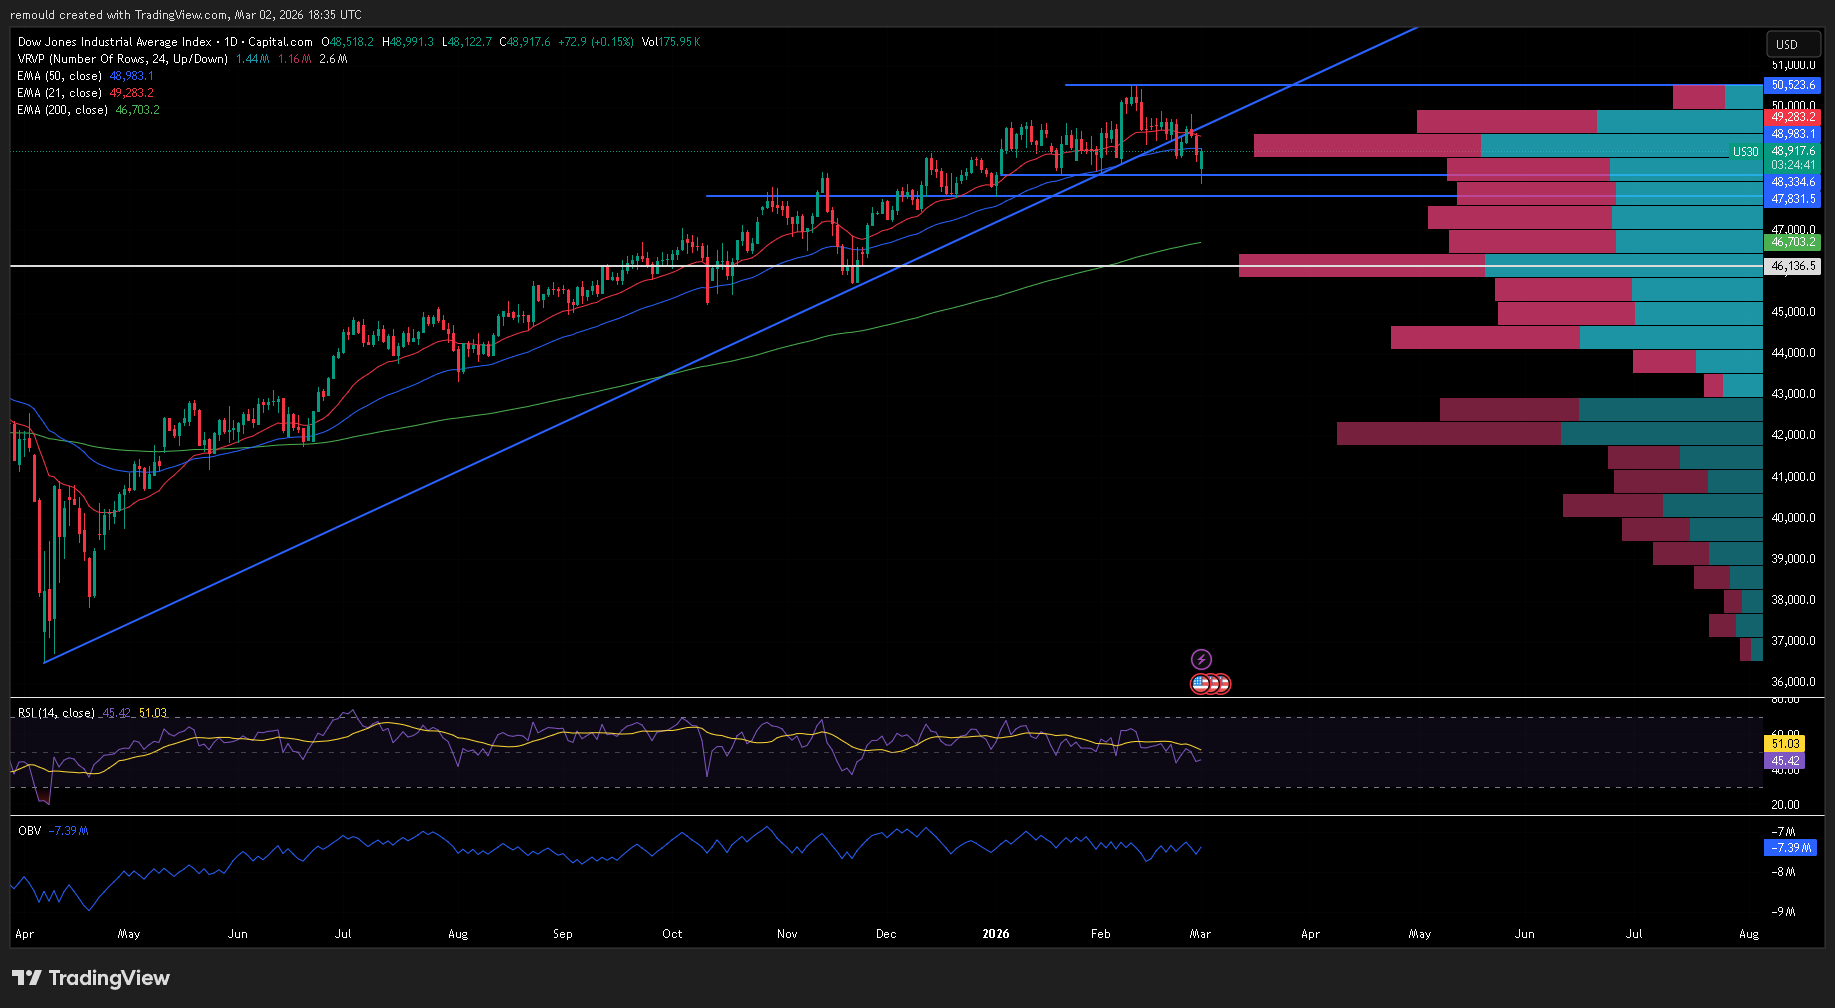
Looking at the daily timeframe, US30 had been compressing into a tightening wedge pattern for weeks — an ascending trendline running from the April 2024 lows on one side, and a descending trendline from the February 10th all-time high at 50,523 on the other.
That wedge has now resolved — and it resolved to the downside. Price has broken below the ascending trendline that held for nearly two years. This is a significant technical event. A trendline that supported the entire rally from the April 2024 lows through to the ATH has now been violated. Today's geopolitical shock was the catalyst, but the structure was already weakening — this break confirms the shift.
Moving Average Breakdown
The EMA structure is painting a bearish near-term picture:
- 21 EMA (49,283): Price is trading well below this — short-term bearish.
- 50 EMA (48,983): Price is sitting just below this level. A daily close below the 50 EMA is a warning sign that momentum is shifting.
- 200 EMA (46,703): Still rising and well below price. The long-term uptrend is intact, but this is the line in the sand for bulls. A test of the 200 EMA would represent a ~4.5% drop from current levels.
The bearish EMA alignment — price below the 21 and 50, with the 21 crossing below the 50 — is the kind of setup that often precedes an accelerated move lower.
Volume Profile: Where the Smart Money Sits
The VRVP (Visible Range Volume Profile) tells an interesting story. The Point of Control (POC) sits around 47,831, which is the most heavily traded price level over this range. Below that, there's a significant volume shelf around 48,334.
What's critical here is the volume gap between current price and the 46,136 horizontal support. If price breaks below the POC at 47,831, there's relatively thin volume down to 46,136 — meaning a move lower could accelerate quickly through that zone.
RSI and OBV: The Hidden Signals
The RSI is sitting at 45/51 — right in neutral territory but leaning bearish. It's been making lower highs while price has chopped sideways, which is a classic bearish divergence signal.
More concerning is the OBV (On Balance Volume) at -7.39M and declining. This tells us that volume has been flowing out on down days more than flowing in on up days. In other words: distribution is happening. Institutions appear to be offloading positions, not accumulating.
What's Driving the Sell-Off
The chart doesn't exist in a vacuum. Here's the fundamental backdrop piling onto the technical weakness:
Geopolitical escalation: US-Israeli strikes on Iran and subsequent Iranian counterattacks have sent oil surging and rattled investor confidence. Brent crude spiked over 13% and fears around Strait of Hormuz disruptions are very real.
Tariff chaos: After the Supreme Court struck down Trump's IEEPA tariffs on Feb 20th, the administration pivoted to Section 122 of the Trade Act, imposing a 15% global tariff. The Dow dropped 800+ points on that announcement alone.
AI disruption fears: IBM dropped 13% last week after Anthropic's Claude Code announcements spooked markets about AI replacing white-collar jobs. Software stocks have been hammered, dragging the broader market down.
Fed uncertainty: Hot PPI data suggests the Fed is stuck — inflation isn't cooling but the economy is weakening under tariff and geopolitical pressure. The classic stagflation dilemma.
Key Levels to Watch
Resistance:
- 48,983 — 50 EMA (immediate resistance, needs to reclaim)
- 49,283 — 21 EMA (short-term trend flipper)
- 50,000 — Psychological round number
- 50,523 — All-time high (Feb 10)
Support:
- 48,334 — VRVP volume shelf
- 47,831 — VRVP Point of Control (critical level)
- 46,703 — 200 EMA (long-term trend support)
- 46,136 — Major horizontal support
Trade Setups
Bullish Scenario: Bulls need to reclaim the broken ascending trendline and close above the 50 EMA (48,983) on a daily basis. That would signal a false breakdown and potential bear trap. Target the 21 EMA at 49,283 first, then the descending trendline resistance around 49,800-50,000. A breakout above 50,000 opens the door back to the ATH. But right now, the burden of proof is on the buyers.
Bearish Scenario: A daily close below 48,334 (volume shelf) opens the door to a test of the POC at 47,831. If that breaks, the volume gap below could see price slide quickly toward the 200 EMA at 46,703 and potentially the 46,136 horizontal support. This would represent a full correction of around 8.5% from the ATH.
Most Likely Scenario: The trendline break, geopolitical shock, tariff uncertainty, and technical weakness all tilt the odds bearish. JPMorgan noted today that the sell-off could represent a buying opportunity for longer-term investors, but the near-term path of least resistance is lower. Watch for a potential retest of the broken trendline from below — if it rejects, that confirms the breakdown and the 47,831 POC becomes the next real battleground.
The Bottom Line
US30 has broken a critical technical level. The ascending trendline from April 2024 — which underpinned nearly two years of uptrend — is gone. Combined with the bearish EMA alignment, declining OBV, and a fundamental backdrop loaded with geopolitical risk, tariff chaos, and AI disruption fears, the character of this market has changed.
The next major test is the VRVP Point of Control at 47,831. If bulls can't mount a defence there, the volume gap below opens a fast track toward the 200 EMA at 46,703 and the 46,136 horizontal support. That would represent a full correction of around 8.5% from the ATH.
For now, the broken trendline becomes resistance. Watch for any retest of that trendline from below — if it rejects, that confirms the breakdown. If price reclaims it and holds, it was a false break. But with the weight of evidence stacking up on the bearish side, the burden of proof is firmly on the bulls.
Stay sharp, manage your risk, and don't fight the tape.
What's your take on US30? Is the trendline break the start of something bigger, or is this a bear trap? Join the discussion on the ChartsView Forum.
Track these levels in real-time on our Live Charts page, and keep an eye on this week's data releases via the Economic Calendar.
Disclaimer: This article is for educational and informational purposes only and does not constitute financial advice. Trading indices like US30 involves significant risk. Always do your own research and consider your risk tolerance before making any trading decisions. Past performance is not indicative of future results.
Introducing the ChartsView Portfolio Tracker — Track Your UK & US Stocks For Free
We're excited to announce a brand new feature on ChartsView — a free Portfolio Tracker that lets you monitor your UK and US stock holdings in one place, with live prices and real-time profit & loss calculations.
Whether you're holding FTSE 100 blue chips or US tech giants, you can now track everything from your ChartsView account — no spreadsheets, no switching between apps.
What Can You Do With It?
The Portfolio Tracker gives every registered ChartsView member their own private dashboard to manage their investments:
Two Separate Portfolios — Keep your UK stocks (LSE) and US stocks (NYSE/NASDAQ) organised in separate tabs, each displaying values in the correct currency.
Live Market Prices — Current prices are pulled directly from Yahoo Finance, so you always know where your holdings stand. Hit "Refresh Prices" at any time for the latest data.
Profit & Loss at a Glance — See your P&L in both pounds/dollars and percentage for every holding, plus your total portfolio value. Green means you're winning, red means... well, you know.
Currency Toggle — Want to see your US holdings in pounds? Or your UK stocks in dollars? Switch between £ and $ with a single click. The live GBP/USD exchange rate handles the conversion automatically.
Smart Search — Don't know the ticker? No problem. Just start typing a company name — "Barclays", "Apple", "Rolls Royce" — and the search will find the right stock for you.
Combined Overview — The Overview tab brings both portfolios together, showing your total investment value across all markets in your preferred currency.
How to Get Started
- Log in to your ChartsView account
- Click Portfolio in the main navigation menu
- Click + Add Holding
- Search for a stock by name or ticker
- Enter your buy price and quantity
- That's it — your portfolio is live
You can add as many holdings as you like, edit them at any time, and delete ones you've sold.
Why We Built This
As traders and investors ourselves, we know the frustration of juggling multiple apps and spreadsheets to keep track of what you own. Most free portfolio trackers either don't cover UK stocks properly or force you to pay for basic features.
We wanted to give ChartsView members something genuinely useful — a clean, simple tool that does exactly what you need without the clutter. And because it's built right into the site, it's always just one click away when you're reading the forum or checking the latest share tips.
What's Coming Next
This is just the beginning. We're already working on more features to help you get even more from ChartsView:
- Share Tips Leaderboard — Track how share tips perform over time and see who the top tipsters are
- Market Dashboard — A full market snapshot with heatmaps, top movers, and sector performance
- Trading Journal — Log your trades, track your strategy, and spot patterns in your performance
- Weekly Email Digest — A Monday morning roundup of the week's best forum topics and share tips
Try It Now
Head over to chartsview.co.uk/portfolio and start building your portfolio. It's completely free for all registered members.
Not a member yet? Register here — it takes 30 seconds and gives you access to the portfolio tracker, our active trading forum, share tips, and much more.
Happy investing!
The ChartsView Team
Prices are provided by Yahoo Finance and may be delayed. The Portfolio Tracker is for informational purposes only and does not constitute financial advice. Always do your own research before making investment decisions.
We're excited to announce that ChartsView has been completely rebuilt from the ground up. After more than a decade of serving the UK trading community, we've upgraded to Joomla 5 with a modern, responsive design that works beautifully on any device. Everything you loved about ChartsView is still here — but better.
Whether you're a seasoned trader or just getting started, the new ChartsView brings you faster access to market insights, an improved forum experience, and a cleaner interface designed for today's trading workflow.