ChartsView - Stock Trading Community

One of the UK's Longest Running Stock Trading Communities

Join thousands of traders discussing FTSE 100, shares, and market strategies. Free membership, live chat, weekly share tips, and trading education.

✓ Free forever   ✓ No credit card needed   ✓ Active since 2012

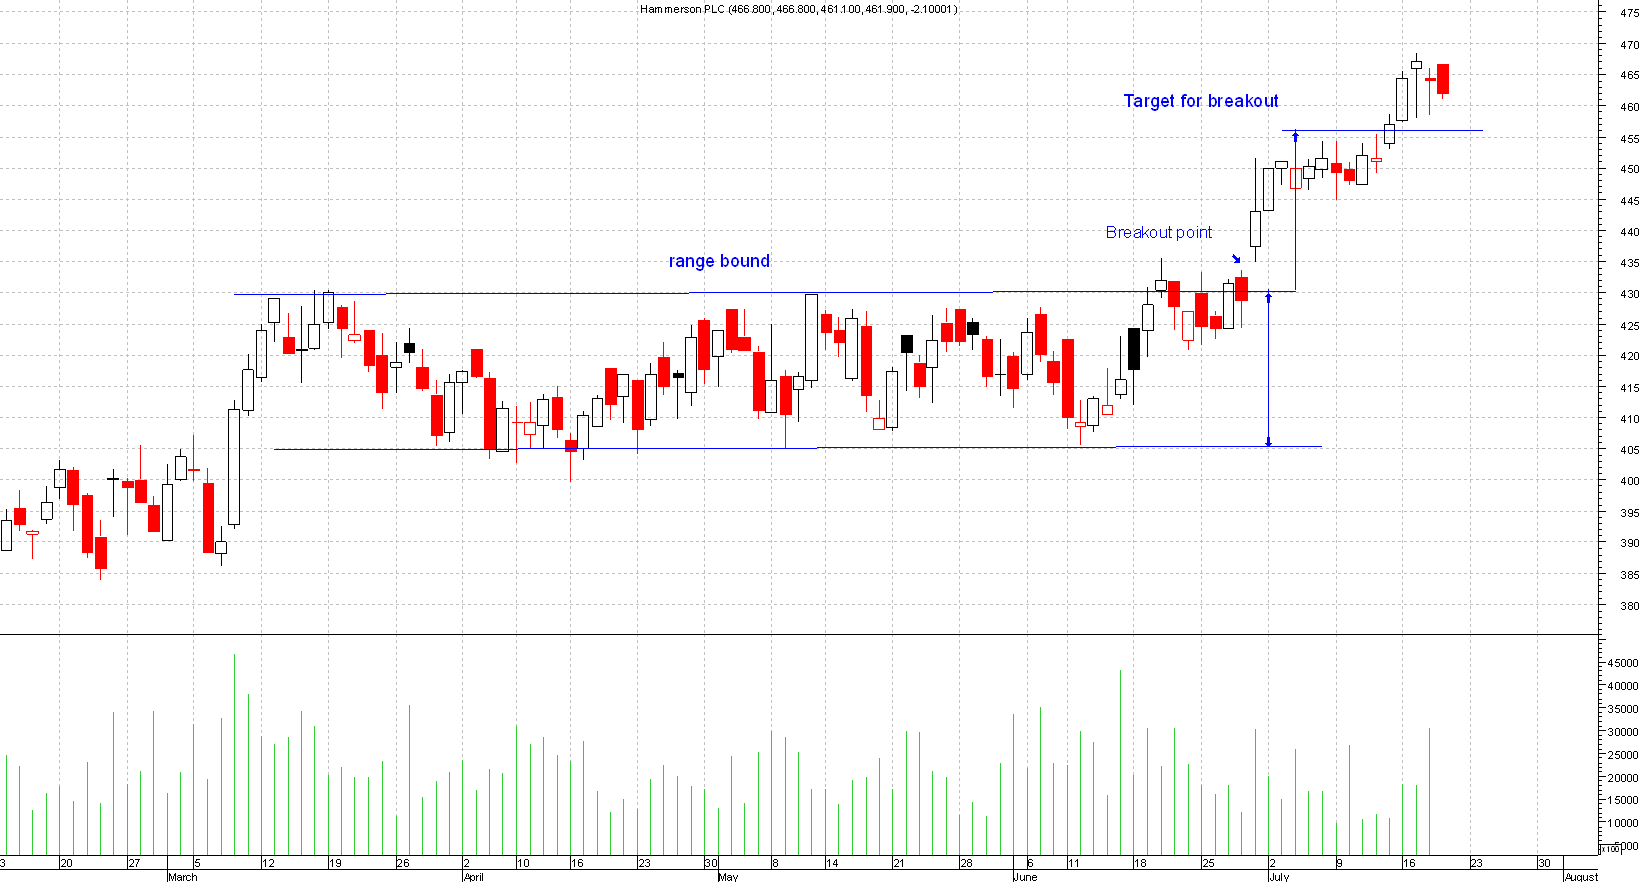
This is a very popular and commonly used pattern in trading. This is basically a consolidation period where prices are trading within a clear range. 

You draw 2 parallel lines, the top and the bottom. This is best traded in the direction of the trend. 

A breakout occurs once the price finishes the day above or below the parallel lines. The target is the height of the trading range added to the break out point.


Please click on chart below for larger image


trading-range


In an uptrend it's best to go long at the bottom of the range and maybe short at the top.

This is good for short term trading and this is a classic example of a buy at support and sell at resistance.

Latest Forum Topics

remo
New Website
remo — 09 Mar 2026 08:36
remo
DOW
remo — 02 Mar 2026 20:45
remo
Feed
remo — 02 Mar 2026 15:35
remo
Tips and stuff
remo — 27 Feb 2026 14:40
remo
Portfolio
remo — 27 Feb 2026 14:30
annes goal
OXB
annes goal — 19 Jan 2026 15:24
remo
NASDAQ 100
remo — 06 Jan 2026 20:49
Trendfriend
Empire Metals - EEE
Trendfriend — 03 Jan 2026 20:46
Trendfriend
Happy Christmas!
Trendfriend — 26 Dec 2025 13:54
remo
GKP
remo — 17 Oct 2025 16:10

Market News

Market Sentiment