This is by far the most famous and popular charting pattern. This pattern consists of a left shoulder, head and a right shoulder.
The head and shoulders appears at the top of a trend and nowhere else.
Please click on the chart below for larger image
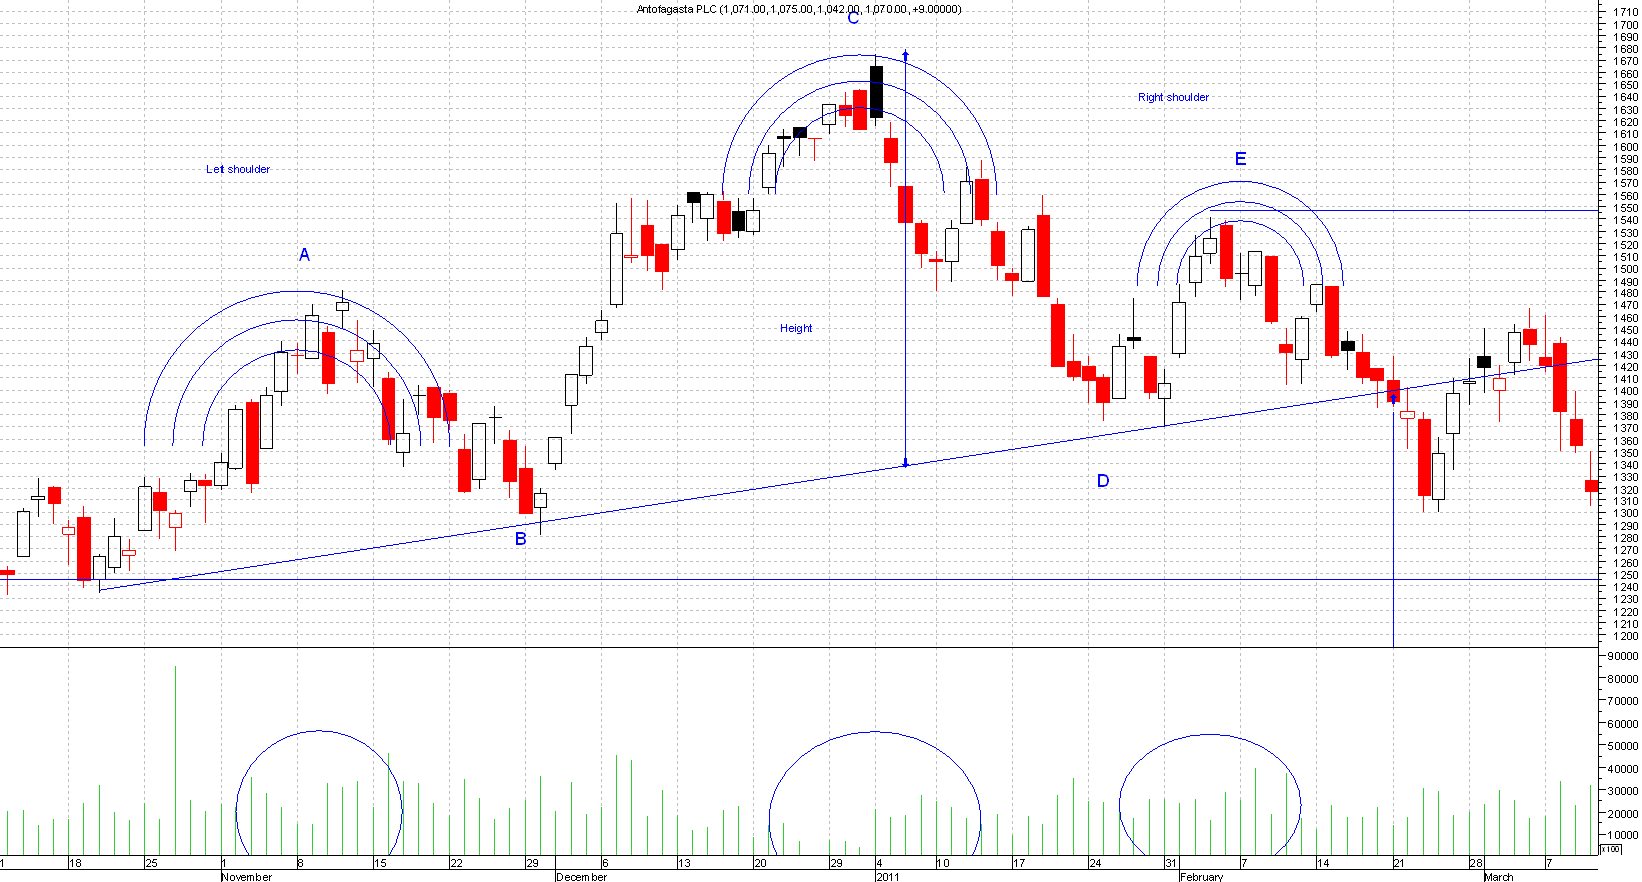
The build up of the left shoulder maybe accompanied by higher than normal volume, point A, then a retrace point B, this will normally be of low volume.
Then you have a rally to point C, this is the head forming. This could be light volume, this passes point A (left shoulder) and then a retrace to point D.
This decline goes lower than point A(left shoulder), at this stage you could get an idea of what's forming. The peak of point A should have held as support so alarms bells may start ringing at this point.
Then you have a rally to point E(right shoulder), this should be light volume. This fails to go higher than point C(head) which is a big no, as each rally should go higher than the previous peak in an uptrend.
So at this point you can draw a neckline from point B through to point D and extend to the right. The sell signal comes once the neckline is breached and higher volume is possible.
If you missed the sell at the neckline break out you can, if lucky, start shorting on the retest of that neckline from below. This doesn't always happen but is most likely. It is also a good idea to get a confirmation of resistance as that adds to the signal.
Please click on the chart below for larger image
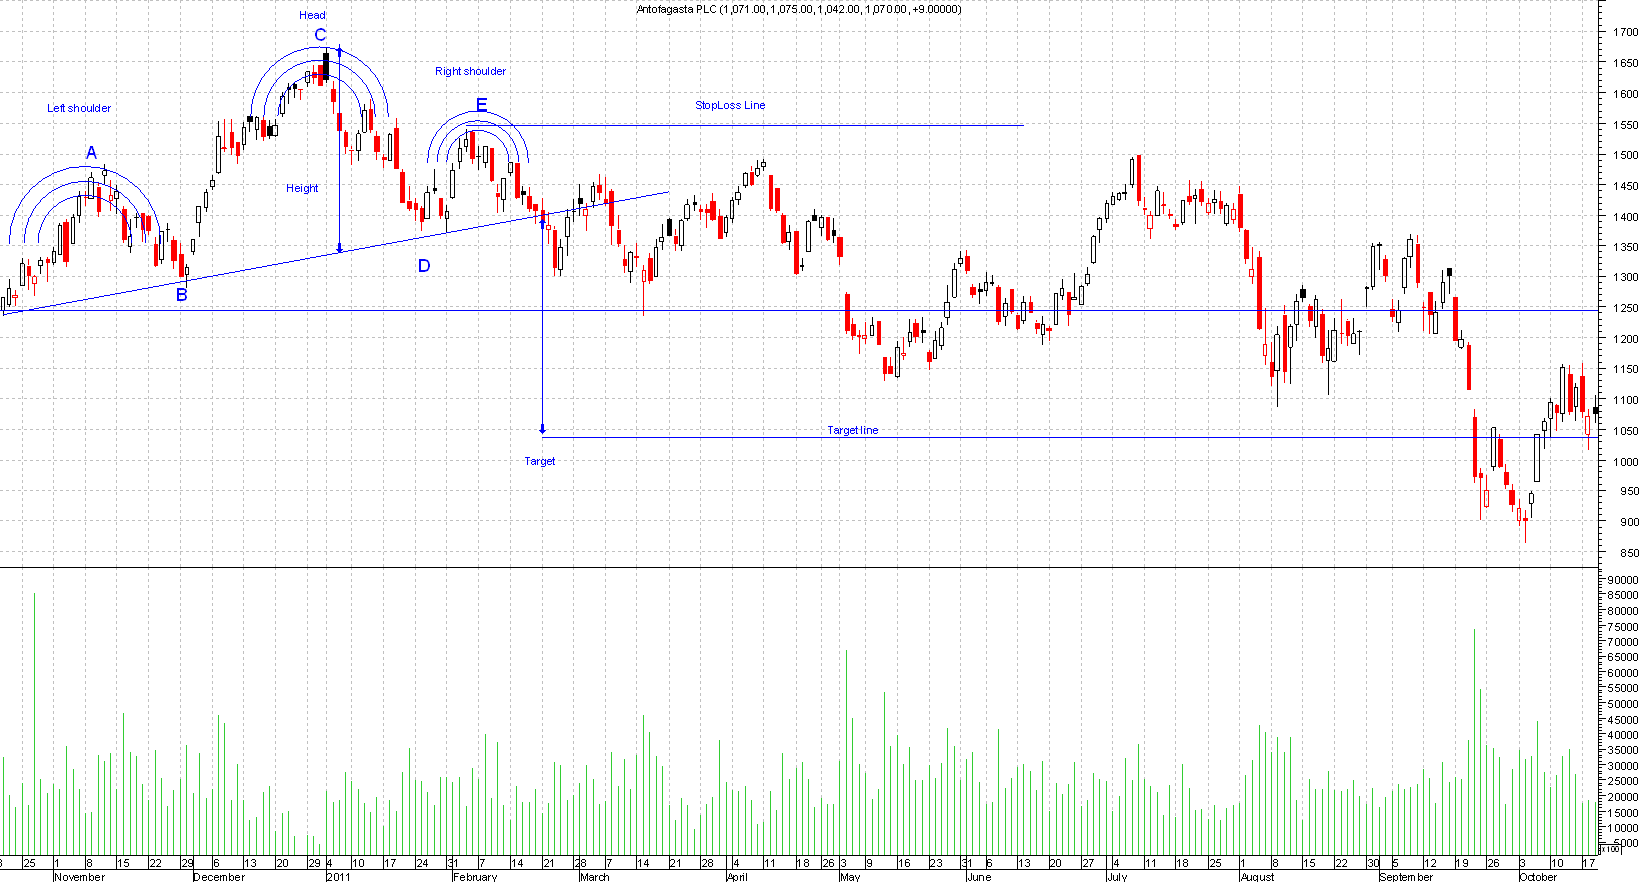
Targets
Once you know you have a head and shoulders break then you take the height (head) to the neckline and that distance should be projected from the break out point and you have your target.
From the chart you can see the target got hit a few months later.
Stops
Stops should be placed above the right shoulder. Some risky traders like to put the stops above the head but that is taking on way to much risk and the risk reward ratio is too low.
Caution
Once the neckline is breached and finished below it, prices should not go above this. If prices did go above this then chances of a failed head and shoulders are high and the previous trend may resume hence why the stops are above the right shoulder.
