ChartsView - Stock Trading Community

One of the UK's Longest Running Stock Trading Communities

Join thousands of traders discussing FTSE 100, shares, and market strategies. Free membership, live chat, weekly share tips, and trading education.

✓ Free forever   ✓ No credit card needed   ✓ Active since 2012

The flag pattern is a continuation pattern and as suggested by the name these pattern form to look like a flag.

They have 2 parallel lines that are slightly on the slope. This slopes up in a downtrend and slopes down in an uptrend.

Flags generally appear in the midpoint of a trend, volume is normally low during the formation but high once it breaks out.


Please click on the chart below for larger image


 flags


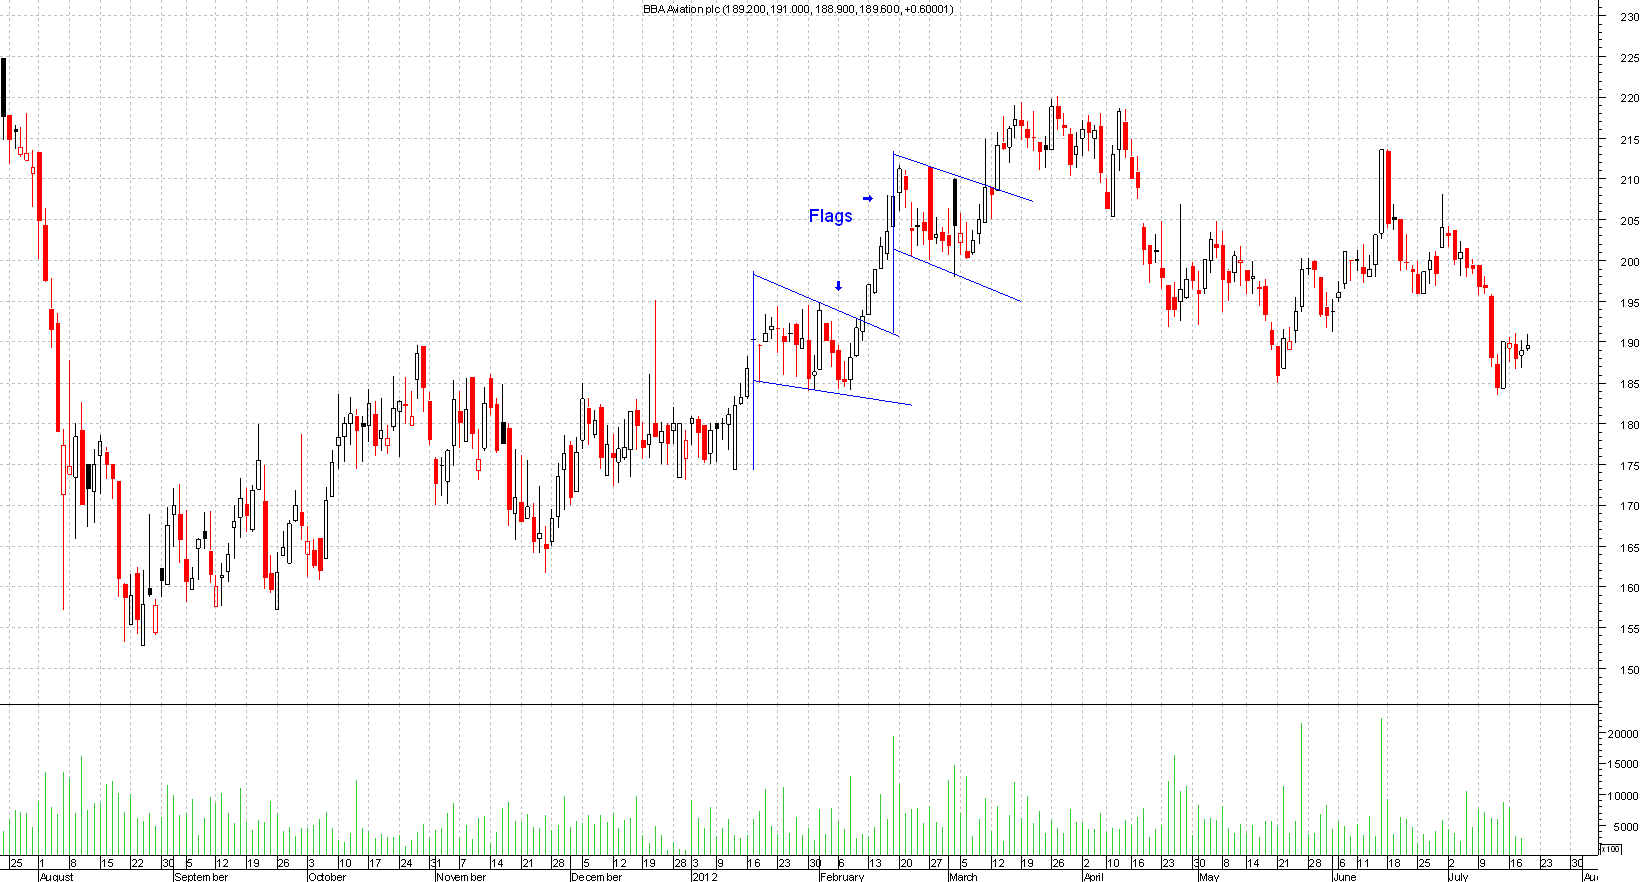
If it's in an uptrend then it should breakout above the top parallel line and the opposite for a downtrend. 

These patterns only last a very short term say 1-2 weeks long. This is the time the shares build its strength.


Latest Forum Topics

remo
New Website
remo — 09 Mar 2026 08:36
remo
DOW
remo — 02 Mar 2026 20:45
remo
Feed
remo — 02 Mar 2026 15:35
remo
Tips and stuff
remo — 27 Feb 2026 14:40
remo
Portfolio
remo — 27 Feb 2026 14:30
annes goal
OXB
annes goal — 19 Jan 2026 15:24
remo
NASDAQ 100
remo — 06 Jan 2026 20:49
Trendfriend
Empire Metals - EEE
Trendfriend — 03 Jan 2026 20:46
Trendfriend
Happy Christmas!
Trendfriend — 26 Dec 2025 13:54
remo
GKP
remo — 17 Oct 2025 16:10

Market News

Market Sentiment