Triangles
There are 3 types of triangles:
• Symmetrical triangle
• Ascending Triangle
• Descending triangle
These are all continuation patterns so are best used in the direction of the trend.
Ascending Triangle
This triangle has a flat trend line on the top and a rising trend line from below.
Ascending triangles are bullish and implies a break higher. This should breakout in the direction of the previous trend.
Volume should be higher on the breakout and once a breakout occurs then that level where it broke out from will now be support.
Please click on chart below for larger image
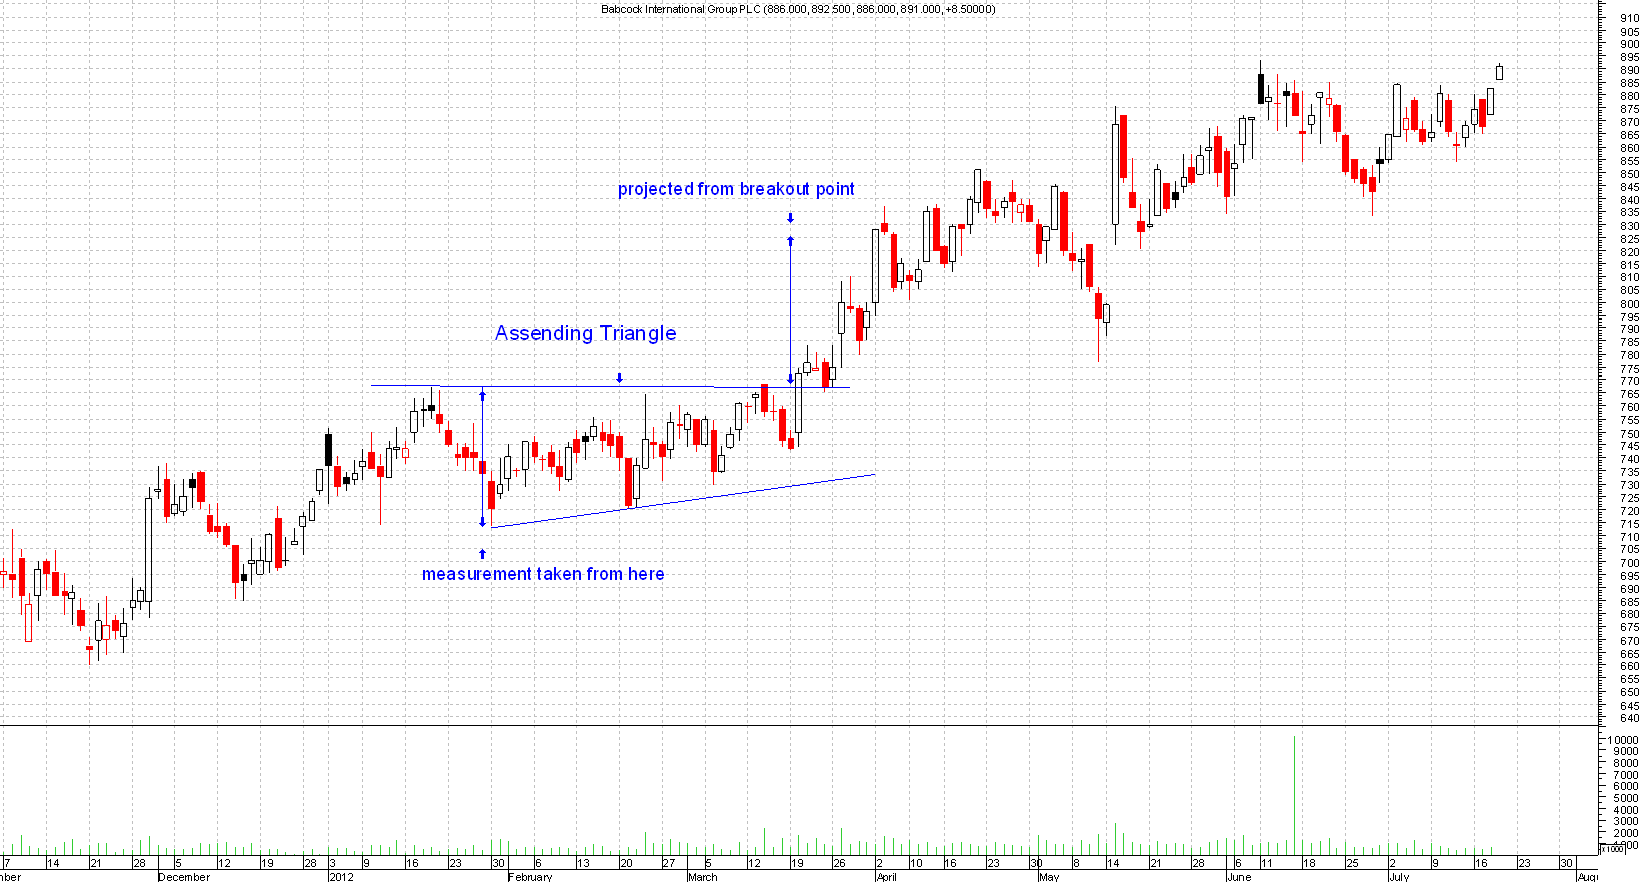
Targets
For the target use the widest point of the triangle as a measuring tool. If for example at the widest point it was 50 pips long then the target is going to be 50 pips from the breakout point.
Note: Triangles can take from 1 month to 3 months to form and any smaller than 2 weeks could be a pennant or flag formation.
