Directions of a Trend
A trend has three directions:
Uptrend:
Downtrend:
Sideways Trend:
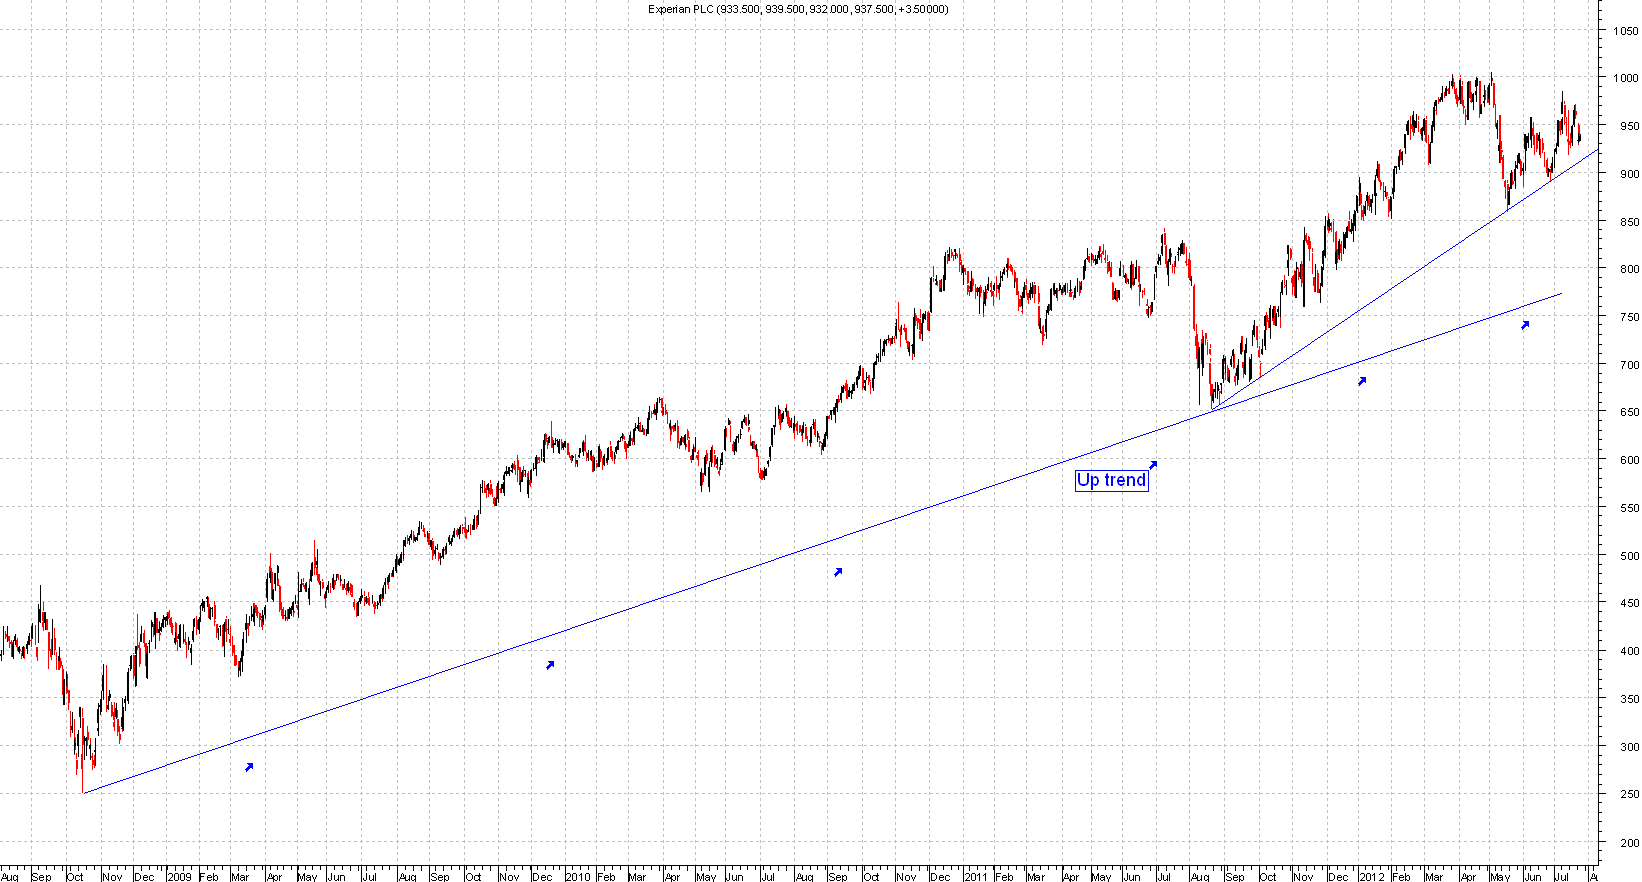
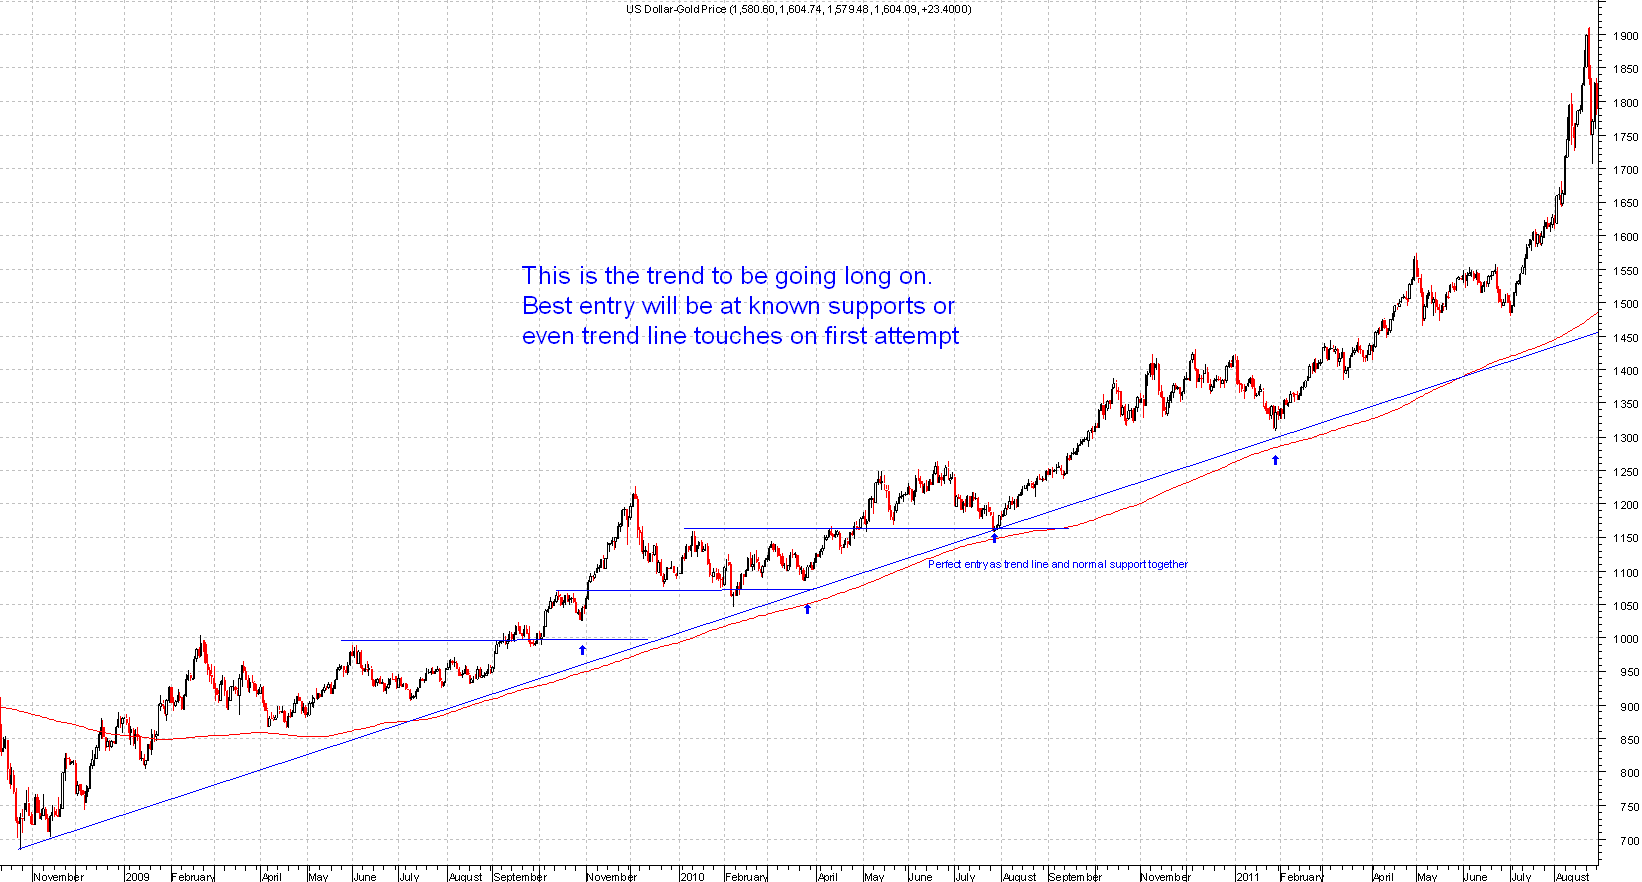
Uptrend
This is the trend to be going long on, this is drawn by joining the bottoms together.
Best entry will be known support or even at the trend line touches as long as you draw them correctly. When you draw uptrend lines you should join the extremes bottom together.
The more touches the better, two points of contact is needed to draw a trend line and a third to make it valid.
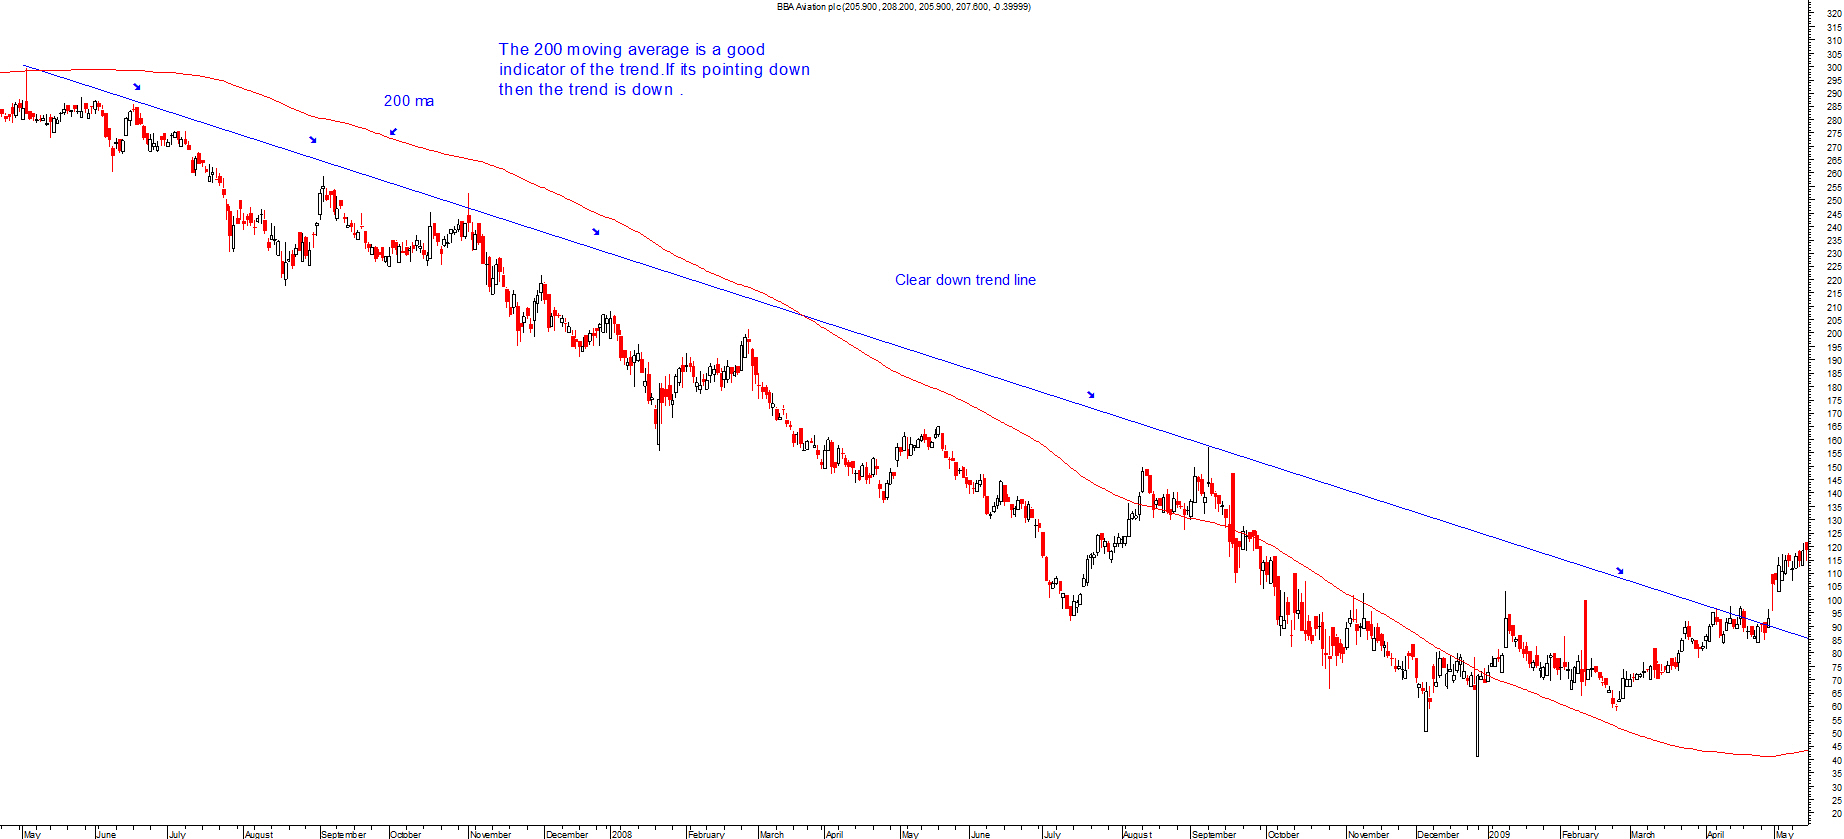
Downtrend
This is the opposite of the uptrend, this is drawn by joining the tops together. Always use the extremes to join the down trend lines as shown on the chart.
In the chart below, the trend line is drawn by taking into account the extremes. You can see the main down trend line, you could see a smaller trend within the main trend as well.
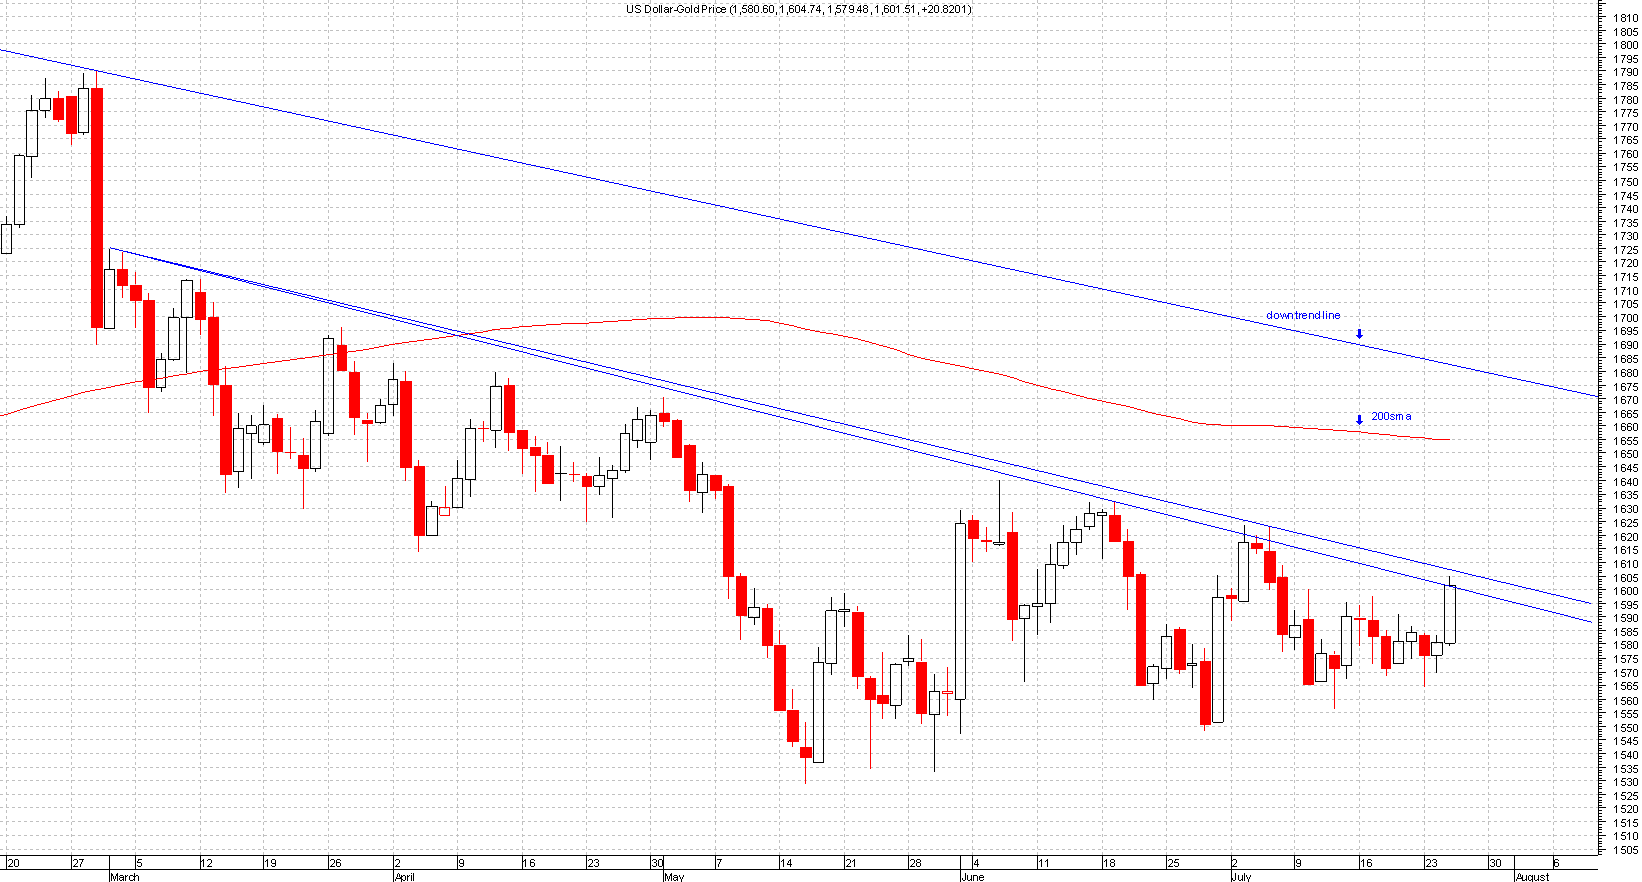
When in a clear downtrend then positions should only be taken by shorting, if unable to short then stay out of the market.
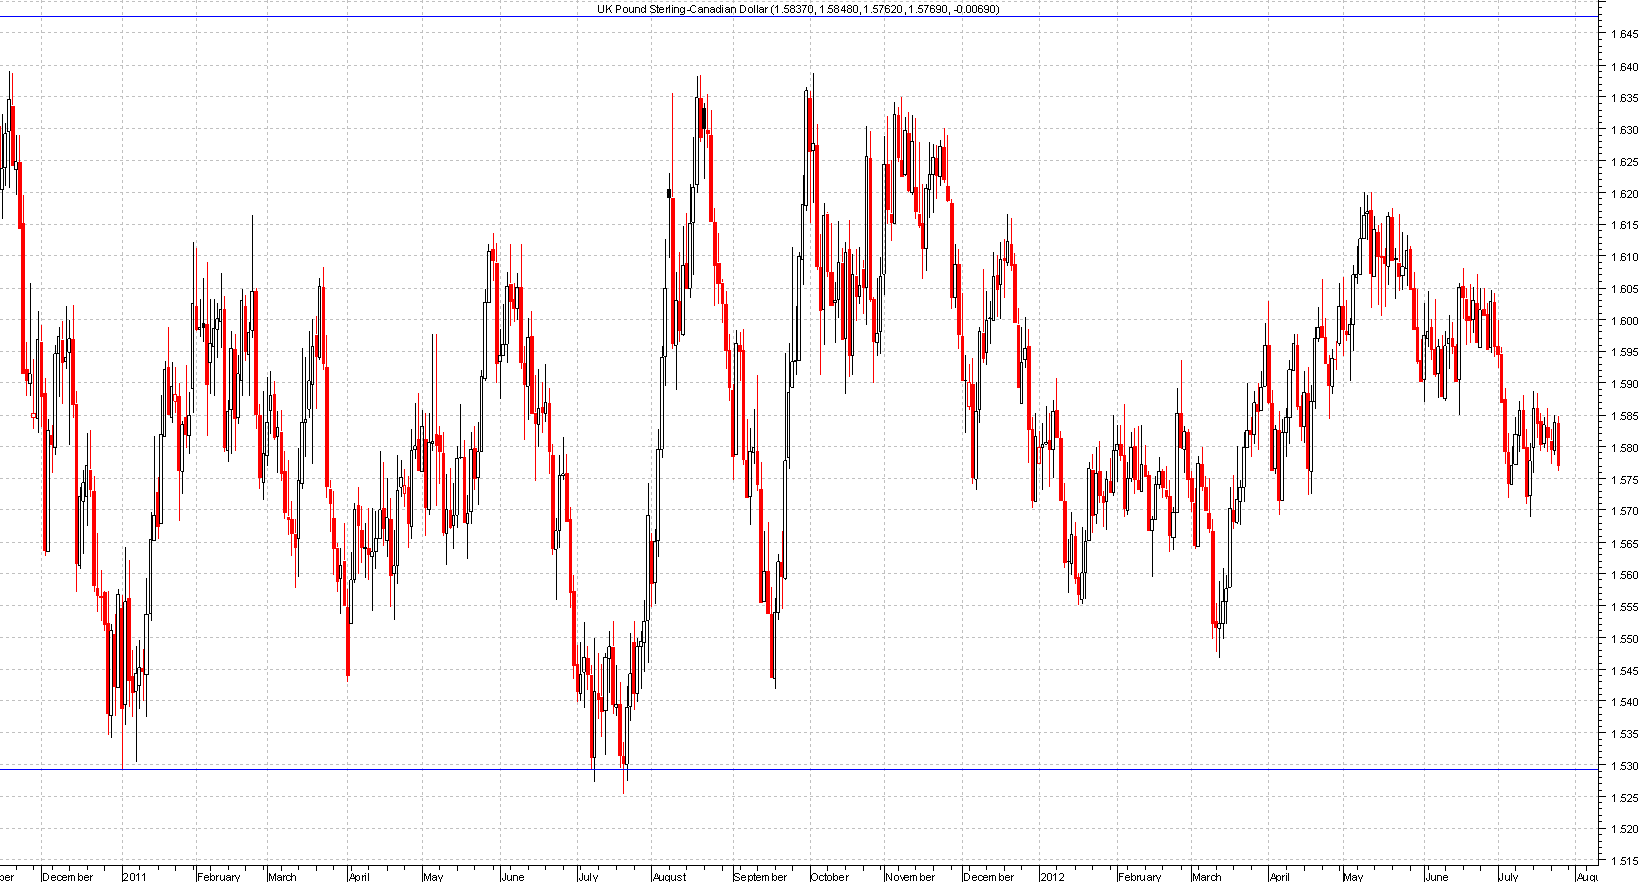
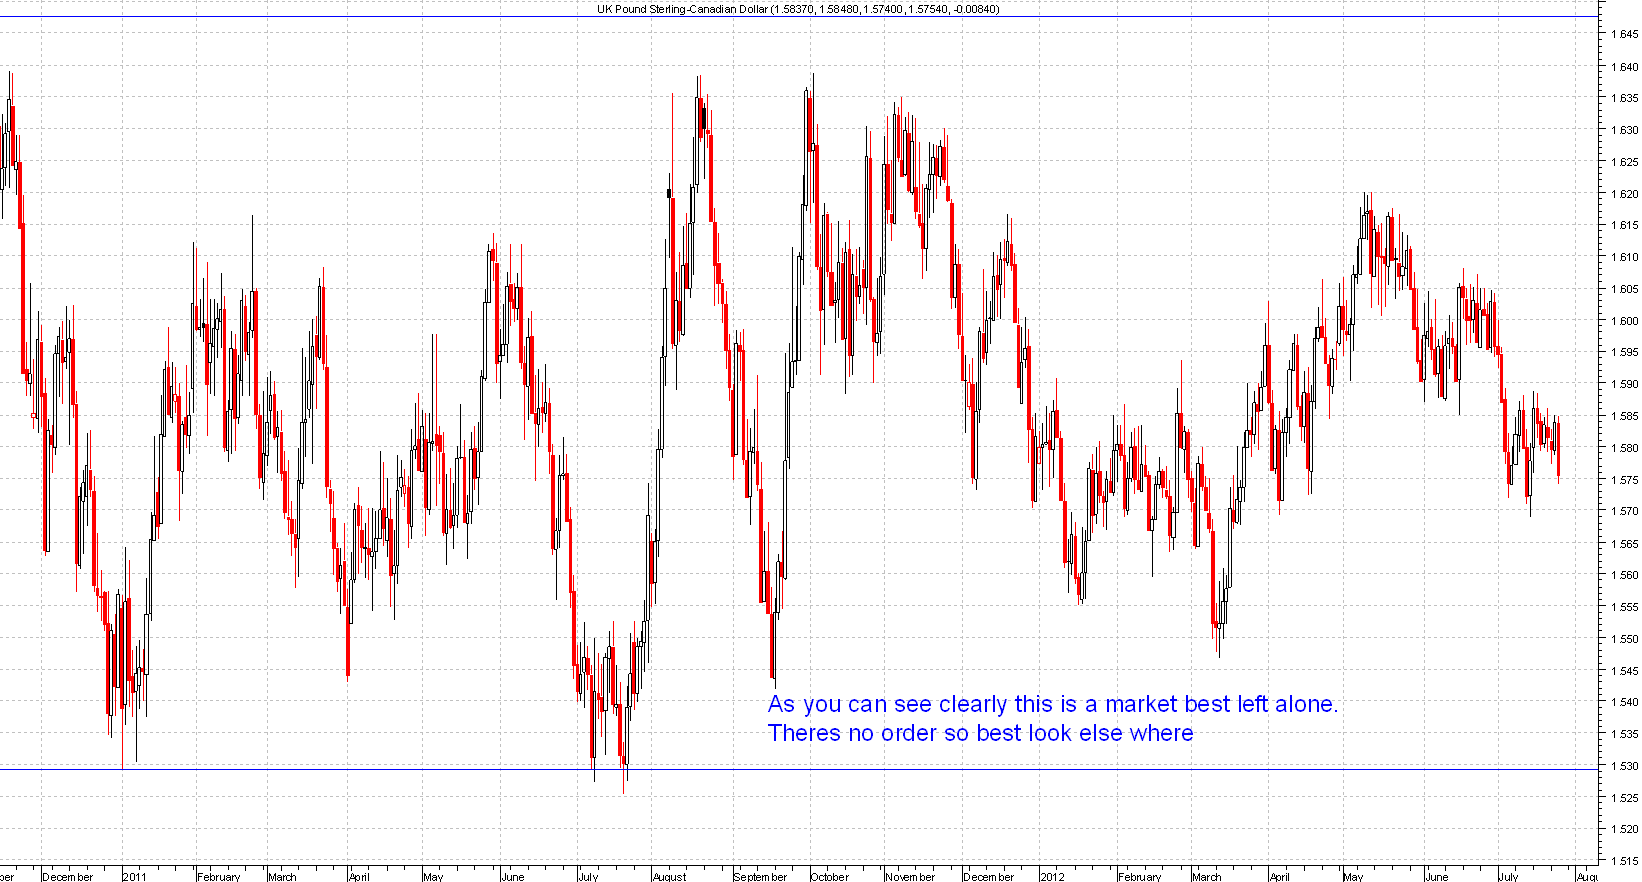
Sideways Trend
When you have a sideways move it represents a period of equilibrium in the price. This normally represents a trend less market.
When you have sideways market the best thing to do is stay out of the market. When using stop losses sideways move normally takes them out which makes it very hard to trade so best left alone unless you trade the ranges.
If you are have difficulty in identifying a trend then the best way to determine a trend is using a 200 day simple moving average.
All you have to do is look to see if it's pointing up or down or sideways. If it's pointing up then you know the trend is up, if its down the trend is down and finally if it's going sideways then the trend is sideways.
The moving average can be altered depending on your what type of trader you are. If you're a long term trader then 200sma(simple moving average) will be fine.
If you're a short term trader then you may look at 21 days sma or smaller time frames.
